You are here
Appendix A: Detailed Methodology
This section provides an overview of the economic impact modeling methodology, including an introduction to the IMPLAN model, an overview on the model input data and methodology, and a discussion of the output metrics used to describe the impacts.
To estimate the economic impacts of HSU on the regional economy, ICF used the economic impact modeling software IMPLAN (version 3.1), which is created and maintained by the Minnesota IMPLAN Group (MIG) and widely used throughout the United States and internationally. State and local government agencies and authorities use IMPLAN for a variety of applications, including transportation and aviation projects. The IMPLAN model is a static input-output framework used to analyze the effects of an economic stimulus on pre-specified economic regions; in this case Humboldt County. The IMPLAN model is based on the input-output data from the U.S. National Income and Product Accounts (NIPA) from the Bureau of Economic Analysis. The model includes 536 sectors based on the North American Industry Classification System (NAICS). The model uses state-specific multipliers to trace and calculate the flow of dollars from the industries that originate the impact to supplier industries. These multipliers are thus coefficients that describe the response of the economy to a stimulus (a change in demand or production). IMPLAN’s outputs include three types of impacts:
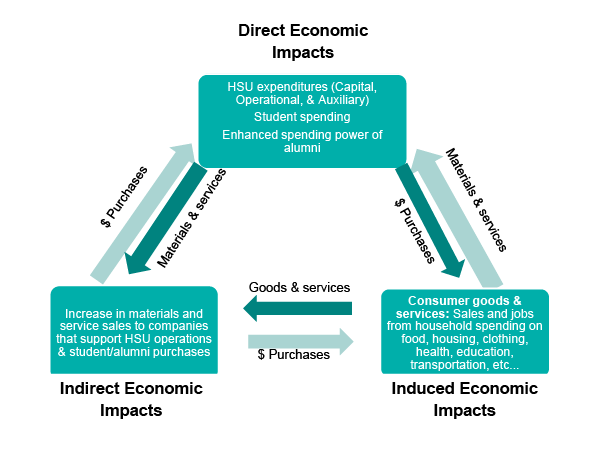
- Direct impacts, which are impacts in the primary industries where spending by the University and its students would be focused, such as university operations, construction-related expenses, local student housing, bookstores, and restaurant/food purchases.
- Indirect impacts, which are impacts in the industries that supply or interact with the primary industries, for example when University capital projects require the purchase of construction-related building materials.
- Induced impacts, which represent increased spending by workers who earn money due to the proposed projects, such as when faculty and staff use their wages at local restaurants.
The IMPLAN model was used to assess the economy-wide and industry-specific impacts of the direct spending associated with operational expenditures, capital expenditures, student spending and the incremental wage increases that alumni gain as a result of their HSU education. The results of this analysis are reported using four commonly-used metrics, consistent with best practices across economic impact analysis. A summary of each metric is provided below:
- Employment: Represents the jobs supported in each industry, based on the output per worker and output impacts for each industry.Labor Income: Includes all forms of employment income generated by the direct input, including employee compensation (wages and benefits) and proprietor income.Industry Activity: Represents the total value of industry activity generated by the direct spending.Tax Impact: Represents the breakdown of taxes collected by state and local government, including corporate taxes, household income taxes, and other business taxes.
Model-Based Analysis
HSU creates economic impact via multiple pathways, from operational purchases and capital spending to student spending activity and increased salaries for alumni. Direct spending by HSU and its students is the most straightforward economic impact of the University—HSU purchases goods and services from the surrounding economy, invests in its infrastructure, and serves as an important regional employer. This direct University activity initiates economic impact throughout the economy. However, this direct spending represents only a portion of the University-generated impact. Direct spending in primary industries generates indirect and induced impacts in secondary industries throughout the economy. The direct spending by the University—on its operations, auxiliary enterprises, capital expenditures, and students—and the multiplier effect of this direct spending is a major part of the University’s overall economic impact on the region. However, the value of HSU is much more than just the impact of its own direct, indirect, and induced spending because of its alumni, who contribute significantly to the broader regional economy.
The full economic impact of the campus on the regional economy, including indirect and induced impacts in sectors beyond the initial spending categories, can be assessed through economic impact modeling. Regional economic modeling is founded on the principle that industry sectors are interdependent: one industry purchases inputs from other industries and households (e.g., labor) and then sells outputs to other industries, households, and government entities. Therefore, economic activity in one sector causes an increased flow of money throughout the economy. The section below explains this model and the data and calculations ICF used to create model inputs.
Model Inputs
This analysis uses the modeling software IMPLAN to calculate economic impacts. IMPLAN is widely used by municipalities, institutions and other organizations and thus the results of this analysis are comparable to other similar assessments of university impacts. The following discussion details the data and calculations ICF used to calculate the inputs for the IMPLAN model. ICF modeled five separate categories of spending:
- Operational Expenditures
- Auxiliary Expenditures
- Capital Expenditures
- Student Spending
- Alumni Incremental Income Spending
University Spending
Although the results for operational, auxiliary, and capital expenditure are analyzed together in the report, they were modeled as three separate input vectors. ICF relied on financial statements provided by HSU for operational expenses, auxiliary enterprise expenses and capital expenditures for the 2017-18 school year. Operational expenditures totaled $168.5 million, auxiliary expenditures were $25.7 million and capital expenditures were $5.5 million on average (see below). In accordance with current best practice, spending associated with student grants and scholarship (financial aid) and depreciation and amortization is not included in the modeling.
HSU’s operating expenses include: instruction, research, public service, academic support, student services, operation and maintenance, and institutional support. HSU’s auxiliary enterprise spending was split between dining hall services ($16 million) and housing and parking ($9.7 million). The input for capital expenditure was developed using a 3-year average from 2015/16 – 2017/18. HSU has already spent $5.5 million in 2018/19 and expects to spend an additional $33 million on capital projects over the course of the 2019/20 and 2020/21 academic years.
Student Spending
The student spending calculations were based on the University’s 2018 fall headcount, which included 7,195 undergraduates, 481 graduate, post baccalaureate, and doctoral students and 98 credential students. ICF received an estimate of undergraduate students living on-campus, off-campus, and with their parents from the HSU Residence Life Office. ICF assumed that all postgraduate and certificate students live off-campus.
ICF used the average “Cost of Attendance” estimates from the HSU Financial Aid Office121 to calculate the total student spending impact. ICF calculated a total of six spending categories including: books and supplies, food (on-campus), food (off-campus/other), housing (on-campus), housing (off-campus), transportation, and miscellaneous. ICF assumed that students living on campus spent approximately 2/3 of their food expenditures at campus dining halls or food stores, while students living off campus only spent 1/3 of their food expenditures on campus. ICF assumed no housing costs for students living with their parents. The HSU financial aid office estimates that on-campus and off-campus housing costs are equal. ICF calculated a total of $101.7 million in off-campus spending and $33.5 million in on-campus spending for 2017/18. Only off-campus student spending was modeled in this analysis to avoid the potential for double-counting. Additionally, student spending on tuition and fees was not modeled for that reason.
Once University expenditures and student spending were estimated, ICF allocated this spending to appropriate IMPLAN sectors. The list of IMPLAN sectors used for this analysis are detailed in Table A1.
Table A1: NAICS codes and IMPLAN Sectors
| IMPLAN Sector | IMPLAN Description |
|---|---|
| 400 | Retail: Food & Beverage Stores |
| 404 | Retail: Sporting goods, hobby, musical instrument and book stores |
| 405 | Retail: General Merchandise |
| 473 | Junior colleges, colleges, universities, and professional schools |
| 55 | Construction of New Educational and Vocational Structures |
| 501 | Full-service restaurants |
| 502 | Limited-service restaurants |
| 503 | All other food and drinking places |
| 412 | Transit and ground passenger transportation |
| 440 | Real estate |
Spending was modeled using local purchase coefficients, meaning that while spending is occurring locally, not all of the direct economic activity is assumed to be retained in the region. A certain percentage of this spending “leaks” to other regions; therefore, for each spending category, the actual spending does not necessarily equal the direct impact calculated by IMPLAN.
It should be noted that the methodology used to estimate student spending in this study differs from the methodology used by ICF in a 2010 study titled, “The Impact of the California State University System”.122 For the current study, ICF analyzed the off-campus living expenses of all students, regardless of their county of residence. This approach, while consistent with other similar studies conducted, differs from the 2010 analysis, which analyzed only those students who came from outside of the region to attend HSU. The current methodology provides a more precise estimate of total student spending compared to the previous analysis.
Alumni Earnings
Alumni impacts are treated separately from the other spending categories in this analysis because they are not expenditures by the University or its students on local goods or services. Instead, the alumni impacts represent the additional earning power of HSU graduates and the economic activity generated by these increased wages, when spent in the local economy.
To only account for alumni in the workforce, ICF applied an age cutoff based on the state’s average retirement age of 64.123 Using national salary data from the U.S. Census Bureau, ICF estimated the increase in alumni salaries due to their HSU degrees, and used IMPLAN to determine the statewide economic impact of this additional income.
Specifically, ICF employed the following methodology:
- Using the average age of an undergraduate and graduate degree recipient, the age of each year’s graduating class was determined and the number of HSU graduates remaining in Humboldt County in each of the U.S Census age cohorts (25-34, 35-44, 45-54, and 55-64) was calculated.
- Data from the U.S. Census Bureau’s Current Population Survey (CPS) were used to estimate the average salary of HSU bachelor’s and master’s degree-level alumni based on their age. The CPS data provides average salary, by age and sex, for Americans of different levels of educational attainment, including high school graduates, individuals with some college but not holding degrees, bachelor’s degree recipients, and master’s degree recipients.124 The weighted average salaries for each age cohort are presented below:
Table A2: U.S. Census CPS Educational Attainment and Earnings
| Age Cohort | Educational Attainment | |||
|---|---|---|---|---|
| High School | Some College | Bachelor’s Degree | Master’s Degree | |
| 25-34 | 33,605 | 35,979 | 57,152 | 75,896 |
| 35-44 | 43,920 | 47,091 | 74,390 | 91,879 |
| 45-54 | 43,875 | 52,979 | 80,447 | 94,163 |
| 55-64 | 46,354 | 51,299 | 78,463 | 99,108 |
- For each graduation year, the total earnings of HSU alumni were calculated by multiplying the number of bachelor’s degree recipients remaining in Humboldt by the weighted average bachelor’s degree salary for that year. The calculation was repeated for master’s degree holders, and the two totals were summed. This total, summed for every year dating back to 1979-1980 for undergraduates, and 1986-87 for master’s degree holders, provides an estimate of the total annual earnings of HSU alumni still living in Humboldt.
- The amount of total earnings attributable to the alumni’s HSU degree is the difference between the weighted average salary associated with their final educational level minus the weighted average salary associated with their previous educational level. For individuals with a master’s degree, for example, the amount of earnings that is attributable to the alumni’s HSU master’s degree is the weighted average master’s salary minus the weighted average bachelor’s salary. For bachelor’s degree holders, the amount of earnings attributable to the alumni’s HSU degree is the weighted average bachelor’s salary minus the weighted average salary for either a high school graduate or transfer student who already had some college credit.
- Some students come to the HSU with a high school diploma only; others transfer after completing some college. The salary differences between bachelor’s degree recipients and high school graduates were calculated as well as the salary difference between bachelor’s degree recipients and transfer students with some college credits. These two differences were weighted based on historical data for the split between the two sources of students in the California State University system that was used in the 2010 CSU Economic Impact Study.125 Lastly, a total earnings differential attributable to the HSU degrees was calculated.
ICF’s calculation of alumni wages represents a conservative approach as it relied on national averages for wages by age and degree type rather than state-specific data. California wages tend to be higher than the national average. In 2017, California real per capita income was approximately $2,650 dollars higher than the U.S. national average.126
It should be noted that the methodology used to estimate alumni impact in this study differs from the methodology used by ICF in 2010. The previous assessment used a cumulative annual chance that an alumnus had left California to determine the number of alumni remaining in the region year to year. Since ICF was able to rely on direct inputs from HSU alumni data, the current study uses a flat percentage chance that alumni will remain in the region or state. Because of this methodological difference, the alumni and total impacts reported in 2010 are not directly comparable to the findings reported in this study. The current methodology provides a more precise estimate of the total number of remaining alumni compared to the previous analysis. The difference between the methodologies results in approximately 4,421 fewer in-region alumni.
- 121 HSU, Financial Aid. 2018. Cost of Attendance - 2018/19. https://finaid.humboldt.edu/co...
- 122 ICF. 2010. Office of the Chancellor, Working for California: The Impact of the California State University System. https://www.calstate.edu/impac...
- 123 Smartasset. 2018. The Average Retirement Age in Every State in 2015. https://smartasset.com/retirem...
- 124 U.S. Census Bureau. 2017. PINC-04. Educational Attainment--People 18 Years Old and Over, by Total Money Earnings, Work Experience, Age, Race, Hispanic Origin, and Sex. https://www.census.gov/data/ta...
- 125 ICF. 2010. Office of the Chancellor, Working for California: The Impact of the California State University System. https://www.calstate.edu/impac...
- 126 Department of Numbers. 2017. California Household Income. https://www.deptofnumbers.com/...